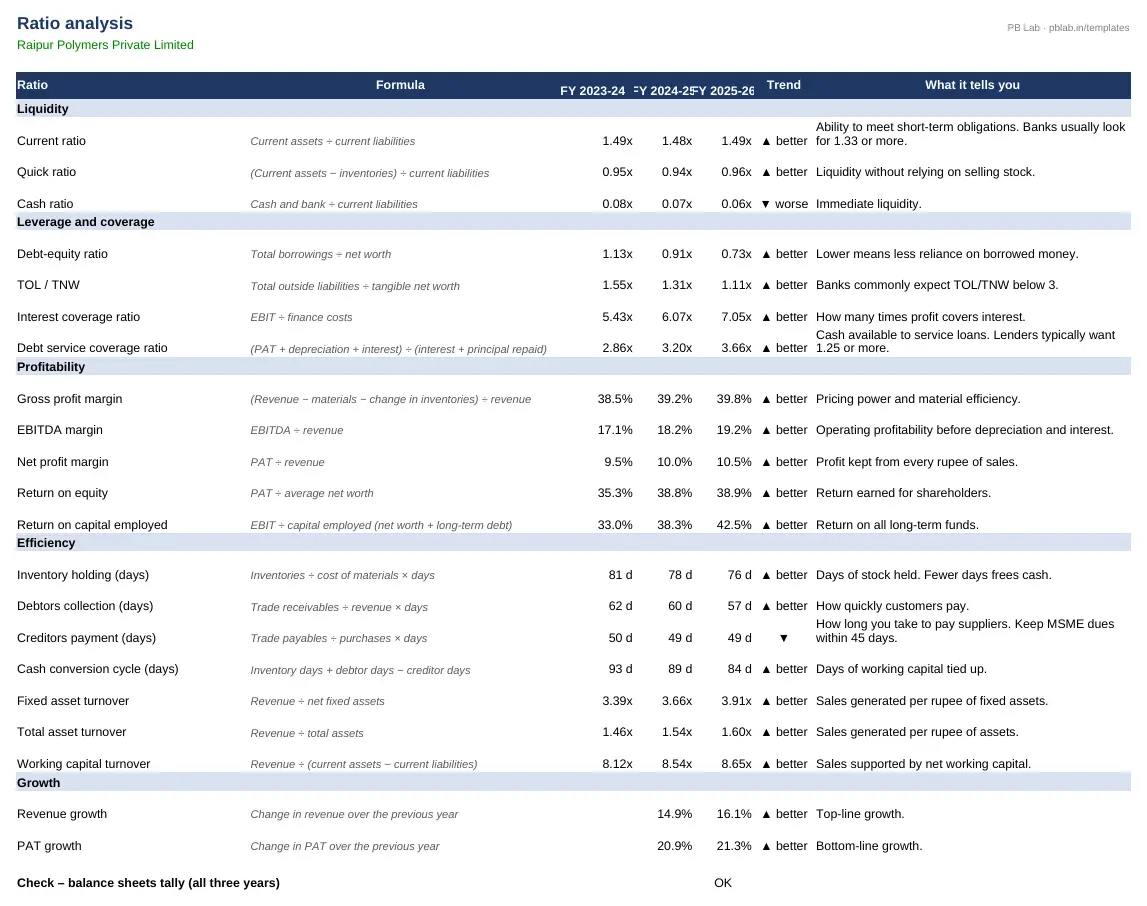
Why ratios, and why three years
A single year's ratios say little on their own. What lenders, investors and management look for is direction — is liquidity improving, is debt coming down, are margins holding up as the business grows? That is why the template takes three years and marks each ratio as better or worse than the year before.
The 20 ratios
Liquidity: current, quick and cash ratios. Leverage and coverage: debt-equity, total outside liabilities to tangible net worth (TOL/TNW), interest coverage and debt service coverage ratio (DSCR). Profitability: gross, EBITDA and net margins, return on equity and return on capital employed. Efficiency: inventory, debtor and creditor days, the cash conversion cycle, and fixed-asset, total-asset and working-capital turnover. Growth: revenue and PAT growth.
These overlap with the 11 ratios that Schedule III has required in company financial statements since the 2021 amendment, so the same inputs serve both purposes. Lenders sometimes define a ratio slightly differently — for example whether current maturities of long-term debt are part of current liabilities — so match their definition if they give you one.
What CMA data is
CMA (Credit Monitoring Arrangement) data is the set of statements banks ask for when you apply for or renew working-capital limits such as cash credit or overdraft. It usually covers the last two audited years, the current year's estimate and one or two projected years. The common forms are the operating statement (Form II), analysis of the balance sheet (Form III), comparative statement of current assets and current liabilities (Form IV), computation of maximum permissible bank finance (Form V) and a funds flow statement (Form VI).
MPBF and the Tandon method
Maximum permissible bank finance (MPBF) is how much of your working-capital gap the bank is willing to fund. Under the second method recommended by the Tandon Committee, the borrower must fund at least 25% of total current assets from long-term sources. So MPBF = working-capital gap (current assets minus current liabilities other than bank borrowings) minus 25% of total current assets. The result implies a minimum current ratio of 1.33.
For smaller limits, banks have also used the turnover method recommended by the Nayak Committee, which sizes the working-capital requirement as a percentage of projected turnover. Each bank has its own policy, so treat these as the standard starting point rather than the final word.
Free vs Pro
The free edition gives you the full ratio analysis. The Pro edition adds the CMA operating statement and working-capital forms, MPBF by Tandon method II with a projected year driven by your growth and holding-period assumptions, a check of whether the limit you request is within MPBF, and charts you can paste into a bank or board note.
Written by Prakash Bagchi, finance professional and founder of PB Lab. Last reviewed .